- Pharmaceutical
The power of Geo mapping software and visualisations
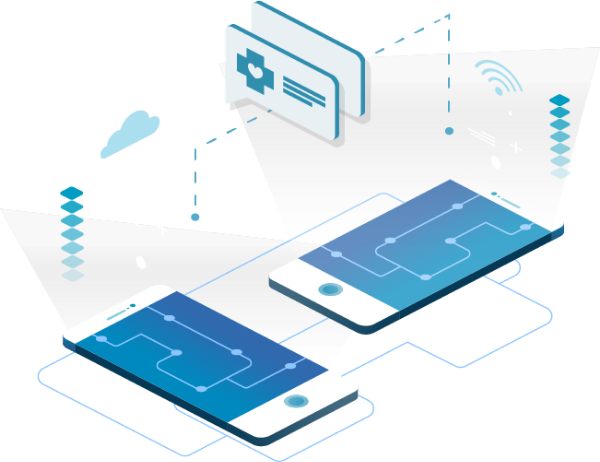
Visualisations and Customisations of datasets.
Presenting information in a geographical story
In the United Kingdom our Client wanted to Measure All 7000 Doctor Surgery’s by certain Indicators in the UK. Our team worked with the Customer to create a Customer Application that enabled the 7000 General Practices to be measured and allowed Visualisations and Customisations of datasets.
Using Tableau and ArcGIS mapping software, Python and Big Data Technology our team of ETL Data Engineers and Visualisation experts worked tirelessly to help improve practices understand their data.
Using Tableau and ArcGIS mapping software, Python and Big Data Technology our team of ETL Data Engineers and Visualisation experts worked tirelessly to help improve practices understand their data.
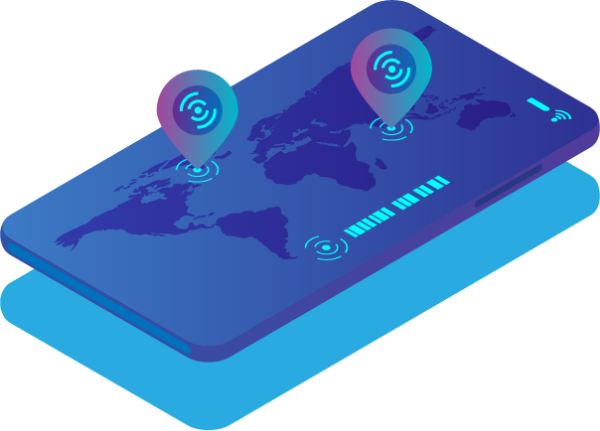
Tableau with the use of Custom mapping Polygons, Funnel Plot Charts, Demographic and Population data all with downloadable options enabled the practice to empower their practice data, thus improving patient health and experience in the long term.
Our Architecture team scaled the Big Data HP Vertica and Tableau environment to allow for multi server failover policy’s using Okta security to enable a seamless digital experience for the General Practices.
Our Architecture team scaled the Big Data HP Vertica and Tableau environment to allow for multi server failover policy’s using Okta security to enable a seamless digital experience for the General Practices.
Technologies used:



- +44 (0) 7958103216
- getsales@carnviewassociates.co.uk

